

Imagine you are in a park, attending a free concert. There are thousands of people around you. You listen to some good music, have fun, maybe take some photos and upload them to your favourite social media platform. Towards the end of the event, you head to the bus stop to go back home. You rush a bit because you are worried the buses will get full, or that there may not be enough of them. And then you would have to wait for at least another half an hour. Once there, though, you notice several buses waiting, ready to leave. Everyone seems to be able to fit on them, and the whole process runs smoothly. The organisers are giving instructions to the crowd, and they seem to have a clear plan on how many people should go where to make sure that everyone gets on a bus. You sit down, happy and tired, enjoying the ride home.
How was this possible? How could they plan how many buses were needed, and where?
Measuring the size of a crowd and predict its movements is a longstanding challenge. Policy makers, stake-holders and academics alike all share the common interest of understanding our collective behaviour. However, systematic large scale studies on our behaviour are traditionally hard to perform. How can we study our mobility patterns without having to purposefully track everybody?
In recent years, the digital revolution may have just provided us with the fascinating opportunity of tackling these challenges[[King G. Ensuring the Data-Rich Future of the Social Sciences. Science (New York, N.Y.), 331,719-721 (2011) ]],[[Lazer D, Pentland L, Adamic AS, Aral S, Barabasi AL, Brewer D, Christakis N, Contractor N, Fowler J, Gutmann M, et al. Computational social science. Science (New York, N.Y.), 323:721—-723 (2009)]],[[Vespignani A. Predicting the Behavior of Techno-Social Systems. Science (New York, N.Y.), 325: 425—-428 (2009)]]. We all produce a constant stream of information thanks to our interactions with the Internet, with technological devices such as smart phones, and social media platforms. Can we exploit these digital traces to study the collective behaviour of a crowd? And that of a city?
Recent research has shown the potential of these new sources of data in studying the spreading of a disease[[Ginsberg J, Mohebbi MH, Patel RS, Brammer L, Smolinski MS, Brilliant L. Detecting influenza epidemics using search engine query data. Nature, 457:1012–4 (2009)]],[[Preis T, Moat HS. Adaptive nowcasting of influenza outbreaks using Google searches. Royal Society Open Science, 1:140095–140095 (2014)]] , predicting the stock market[[Bordino I, Battiston S, Caldarelli G, Cristelli M, Ukkonen A, Weber I. Web search queries can predict stock market volumes. PLoS ONE, 7:e40014 (2012)]],[[Preis T, Moat HS, Stanley HE. Quantifying trading behaviour in financial markets using Google Trends. Scientific reports, 3:1684 (2013)]], and measure the relationship between the environment around us and health[[MacKerron G, Mourato S. Happiness is greater in natural environments. Global Environmental Change, 23:992–1000 (2013)]],[[Seresinhe CI, Preis T, and Moat HS. Quantifying the Impact of Scenic Environments on Health. Scientific Reports, 5 (2015)]]. Researchers are now drawing upon the information stored in our digital traces to better understand cities as well as the people living in them.
In our contribution to this growing body of research, we set out to tackle the longstanding challenge of measuring the size of a crowd using data derived from our interactions with mobile phones as well as the social media platform Twitter[[Botta F, Moat HS, Preis T. Quantifying crowd size with mobile phone and twitter data. Royal Society Open Science, (2):150162 (2015)]]. In this study, we were able to retrieve data on mobile phone and Twitter activity for the city of Milan, Italy, as part of the 2014 Telecom Italia Big Data Challenge. However, having the data is not enough. The next big challenge was the following: where do we find an example in which we accurately know how many people there are in a specific place at a given time? At the Data Science Lab, where this study was carried out, we had the idea of using football matches. We know how many people are in the stadium thanks to the number of tickets that have been sold. We can then compare these figures with the aggregated mobile phones or social media activities to see if there is any relationship. To do so, we have to extract the necessary information from the data for the specific geographical location where the football stadium is located.
In the figure, we depict the temporal evolution of mobile phone calls, SMSs, Internet usage, and Twitter inside the football stadium San Siro in Milan. We also present the number of attendees recorded at the football matches that took place during the period of analysis. Visual inspections reveals that matches with a larger number of attendees correspond to a greater activity both of mobile phones and Twitter. Indeed, our findings suggest that our digital traces may offer surprisingly accurate estimates of the size of a crowd. Further work will address how these results generalise to different situations, such as different types of events, and how they can be applied to real scenarios where we have no ground truth data to compare to our estimates. Our results so far are of clear practical value for a range of business and policy stakeholders who may have to quickly and accurately estimate the size of a crowd to facilitate emergency operations and avoid crowd disasters.
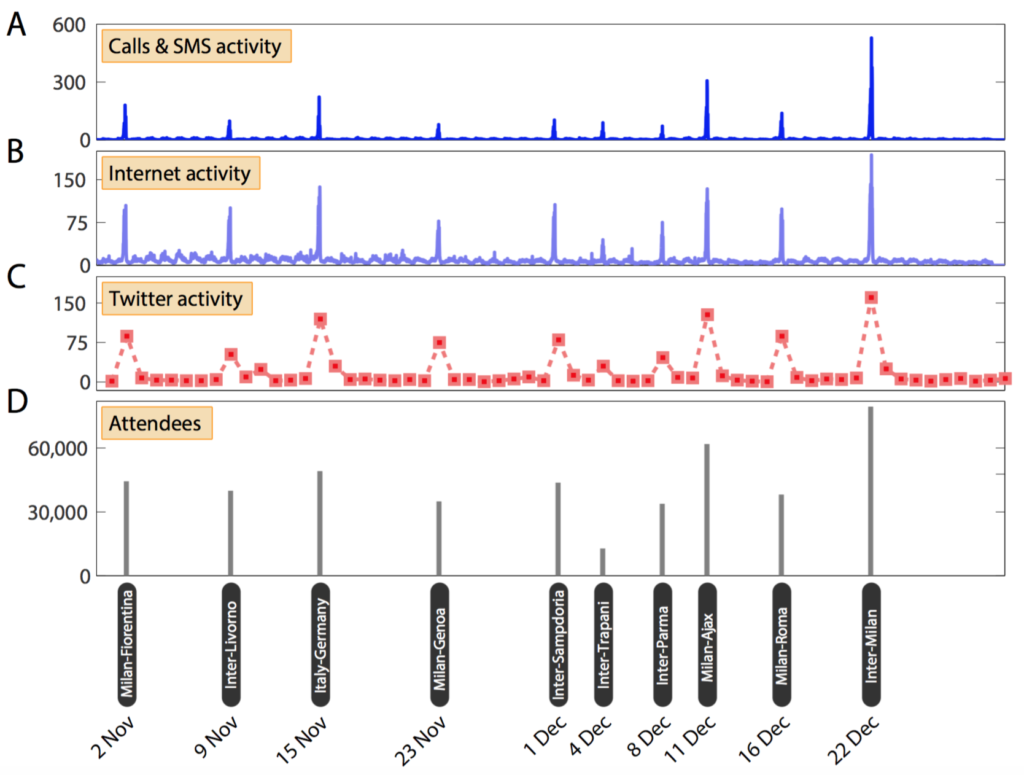
We present mobile phone and Twitter activity in football stadium San Siro. We depict the time series of phone calls and SMS activity (A), Internet connection activity (B), and daily count of tweets (C) recorded in the football stadium during the period of analysis between 1 November 2013 and 31 December 2013. We also plot the number of attendees at the football matches that took place during the same period (D). Visual inspection suggests a remarkable similarity between the time series. Mobile phone and Twitter data were retrieved as part of the 2014 Telecom Italia Big Data Challenge. Figure taken from[[Botta F, Moat HS, Preis T. Quantifying crowd size with mobile phone and twitter data. Royal Society Open Science, (2):150162 (2015)]].
But, of course, it doesn’t stop to this. Researchers have shown that our mobility can be studied using mobile phones and social media data[[Gonz ́alez M, Hidalgo C, Barab ́asi AL. Understanding individual human mobility pat- terns. Nature, 453, 779–782 (2008)]][[Barchiesi D, Preis T, Bishop S, Moat HS. Modelling human mobility patterns using photographic data shared online. Royal Society Open Science, 2:150046 (2015]]. Using our digital traces, scientists have designed algorithms to understand our collective experience of a city[[Quercia D, Schifanella R, Aiello LM. The shortest path to happiness. Proceedings of the 25th ACM conference on Hypertext and social media – HT ’14, pages 116–125 (2014)]],[[Quercia D, Aiello LM, Mclean K, Schifanella R. Smelly Maps: The Digital Life of Urban Smellscapes. AAAI Publications, pages 327–336 (2015).]],[[Quercia D, Aiello LM, Schifanella R. The Emotional and Chromatic Layers of Urban Smells. arXiv preprint arXiv:1605.06721, pages 309–318 (2016)]]. How happy is the path between home and work? How does a neighbourhood smell? And how noisy is the street where you may want to buy a house? Traditionally, little focus has been given to how people experience their own cities. This is drastically changing now though. We walk through a park and upload a photo of the scenic view on Twitter. We stop in a food market and share that on Instagram. We are constantly generating information that is adding up to build a detailed picture of how we feel about the city we are living in. This knowledge can be incorporated in the design of the environment surrounding us, to improve our experience of the place we live in and adapt it our needs.
The integration of large social data sets with rigorous scientific methodologies provides an unprecedented opportunity to design smarter and more conscious cities. Public transport and infrastructures can be designed to dynamically adapt to how individuals are experiencing the city, to make it smarter, cleaner and more pleasant. When large events take place, such as our opening example, but also demonstrations or protests, authorities can ensure a safe environment with the appropriate amount of resources, such as trains, buses, ambulances, police forces and so on.
Smart and conscious cities may be just round the corner. It might be a digital corner, made of algorithms and digital traces, but it will help us design a more dynamic and effective built environment.
References
- 1 Demographic Yearbook of Poland 2019, Statistics Poland. https://stat.gov.pl/en/topics/statistical-yearbooks/statistical-yearbooks/demographic-yearbook-of-poland-2019,3,13.html
- 1 Demographic Yearbook of Poland 2019, Statistics Poland. https://stat.gov.pl/en/topics/statistical-yearbooks/statistical-yearbooks/demographic-yearbook-of-poland-2019,3,13.html